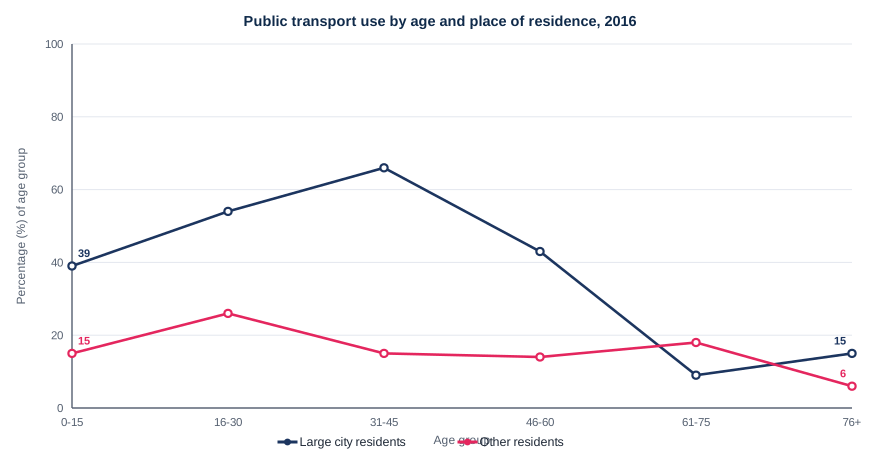
Line graph — Public transport use by age group and place of residence (2016)
📄 Bài mẫu band 8–9
| Introduction | Paraphrase: tỷ lệ người dùng phương tiện công cộng năm 2016 theo nhóm tuổi và nơi ở. |
| Overview | Overall: dân thành phố lớn dùng nhiều hơn hẳn ở các nhóm dưới 60 tuổi và dao động rất mạnh, trong khi nhóm còn lại khá bằng phẳng; ở tuổi 61-75 thứ tự đảo ngược. |
| Body 1 | Đường thành phố lớn: 39% (0-15) → đỉnh 66% (31-45) → 43% → đáy 9% (61-75) → 15% (76+). |
| Body 2 | Đường nơi khác: dao động hẹp 14-26%, đỉnh 26% ở 16-30, đáy 6% ở 76+; vượt dân thành phố ở nhóm 61-75 (18% so với 9%). |
The line graph compares how often people in large cities and people living elsewhere used public transport in one country in 2016, broken down into six age bands.
Overall, city dwellers were far heavier users of public transport in every age group up to 60, and their figures fluctuated sharply across the age range, whereas the line for other residents stayed relatively flat. Interestingly, the ranking was reversed among 61-75 year-olds.
Among large city residents, 39% of children up to 15 travelled by bus or train. The proportion then rose to 54% for 16-30 year-olds and peaked at 66% in the 31-45 band, the widest gap of all: at that age only 15% of people outside the cities did the same. From this high point the figure fell to 43% and then collapsed to a low of 9% among 61-75 year-olds, before recovering to 15% for the oldest group.
The second line moved within a much narrower range. It began at 15%, reached its high of 26% for young adults, and then hovered between 14% and 18% for the next three bands, so that this group overtook city residents at 61-75. Only 6% of the over-75s used public transport, the lowest figure on the graph.
| far heavier users | dùng nhiều hơn hẳn |
| fluctuated sharply across the age range | dao động mạnh theo nhóm tuổi |
| stayed relatively flat | khá bằng phẳng |
| peaked at 66% | đạt đỉnh 66% |
| collapsed to a low of 9% | rơi xuống đáy 9% |
| hovered between 14% and 18% | dao động quanh 14-18% |
| overtook city residents | vượt qua dân thành phố |