Pie charts — Proportion of student expenditure in 2000 and 2010
📄 Bài mẫu band 8–9
| Introduction | Paraphrase: tỷ lệ các khoản chi của sinh viên một trường đại học năm 2000 và 2010. |
| Overview | Overall: cơ cấu dịch chuyển từ quần áo sang tiện ích và ăn ngoài; ăn uống tại nhà vẫn là khoản lớn nhất ở cả hai năm. |
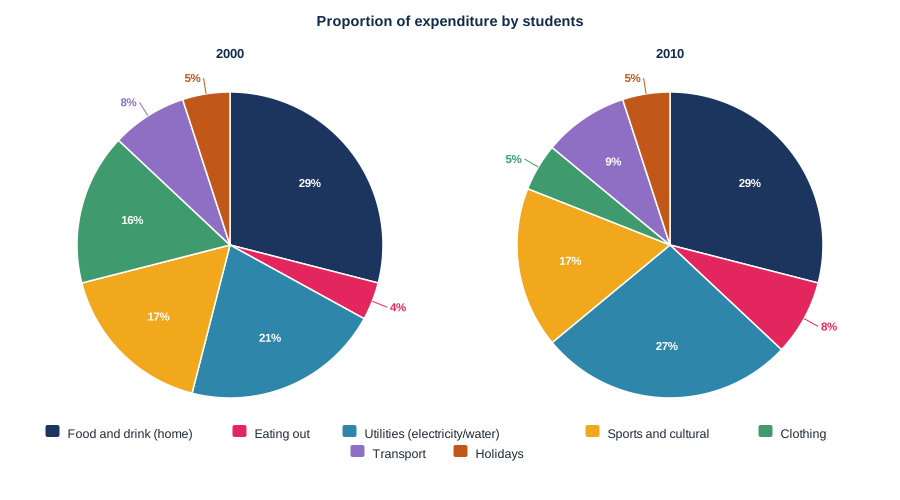
| Body 1 | Nhóm đổi mạnh: clothing 16% → 5%; utilities 21% → 27%; eating out 4% → 8%. |
| Body 2 | Nhóm đứng yên: food and drink at home 29%; sports and cultural 17%; holidays 5%; transport 8% → 9%. |
The two pie charts compare the proportion of money that students at one university spent on seven categories in 2000 and in 2010.
Overall, the pattern of student spending shifted noticeably over the decade, with clothing losing much of its share to household utilities and eating out. Food and drink prepared at home, however, remained the single largest item in both years.
The most dramatic change concerned clothing, which fell by more than two thirds, from 16% of the average budget to just 5%. Utilities such as electricity and water moved in the opposite direction, climbing six percentage points from 21% to 27%, while the share spent on eating out doubled from 4% to 8%.
By contrast, several categories were almost unaffected. Food and drink at home accounted for exactly 29% on both occasions, sports and cultural activities held steady at 17%, and holidays continued to take 5% of the total. Transport rose only marginally, from 8% to 9%. Taken together, these figures suggest that the money freed up by spending less on clothes went mainly on bills and on meals away from home.
| shifted noticeably | dịch chuyển rõ rệt |
| remained the single largest item | vẫn là khoản lớn nhất |
| fell by more than two thirds | giảm hơn hai phần ba |
| climbing six percentage points | tăng sáu điểm phần trăm |
| doubled from 4% to 8% | tăng gấp đôi từ 4% lên 8% |
| held steady at | giữ nguyên ở mức |
| the money freed up by | khoản tiền dôi ra nhờ |